Measure Heat Conduction with AI-Assisted Simulations
Students measure the thermal conductivity of salt and silicon atom by atom, in experiments that an AI agent sets up at their request.
Heat flows from a hot place to a cold one. Fourier's law states how fast: the heat current through a material is proportional to the temperature gradient, the change of temperature per unit length. The constant of proportionality is the thermal conductivity, written κ and measured in watts per meter per kelvin. Copper conducts about 400 W/(m·K), silicon about 150, and table salt about 6.5. In an electrical insulator such as salt, heat is carried by phonons, the quantized vibrations of the crystal lattice. A phonon travels some distance before it scatters off another phonon or a defect. That distance is the phonon mean free path, and it sets the conductivity of the crystal.
In AIMS, students measure thermal conductivity by talking to an AI agent. They describe the experiment in plain language, and the agent loads a crystal into a molecular dynamics simulation, holds its two ends at different temperatures, charts the temperature along the crystal, and computes κ from the measured gradient and heat current. The window below shows the example on sodium chloride. Press Play to run the experiment: the bottom band of the slab is held at an average of 500 K and the top band at 100 K, and each ion is colored by its kinetic energy, red for fast and blue for slow.
A Crystal Between a Hot Bath and a Cold Bath
The experiment is the one a materials laboratory performs on a bar of metal: heat one end, cool the other, and measure the temperature along the bar and the power that flows through it. In the simulation, the crystal is a slab with free surfaces at both ends. Every slab in this article is two unit cells wide, about 1.1 nm, and repeats periodically sideways, so the heat flows along one direction only. Two thermostats act as the heat baths. One acts on the atoms in the bottom fifth of the slab and holds the average temperature of that band at the hot setpoint, and the other holds the average of the band in the top fifth at the cold setpoint. The temperature inside each band is uneven. The thermostat adds energy to every atom of the hot band, but the heat can leave only through the band's inner edge, so the outer layers run hotter than the setpoint and the inner layers run cooler. In the first silicon run, the hot free surface reached about 840 K against a setpoint of 600 K. The atoms between the two bands have no thermostat, so their energy changes only by the heat that flows in from the hot band and out to the cold band.
The simulation divides the slab into thin layers and records the temperature of each layer as the run goes on. After the first ten or twenty picoseconds, the profile stops drifting: the heat entering from the hot bath equals the heat leaving through the cold bath. The agent averages the profile over the second half of the run and fits a straight line to the layers between the two bands, leaving out the layer next to each band. The slope of that line is the temperature gradient. The heat current is the energy the hot thermostat adds per unit time, averaged with the energy the cold thermostat removes. Fourier's law then gives the conductivity: κ equals the heat current divided by the cross-sectional area of the slab and by the gradient.
The first run of the salt example uses a slab of 256 ions, 4.2 nm long and 1.27 nm2 in cross-section, held at 500 K and 100 K for 30 picoseconds. The interior gradient is 72 ± 4 K/nm, and the heat current through the slab is 209 nanowatts. Together these give κ = 2.3 W/(m·K), with a range of 2.2 to 2.4 from the scatter of the layer temperatures. The value is about a third of the handbook value of 6.5 W/(m·K). Because the profile is averaged over the second half of the run, the average for this short run begins at 15 picoseconds, near the end of the warm-up. The baths are set 400 K apart because, in trial runs on silicon with baths 100 K apart, the interior gradient was smaller than the temperature fluctuations of the few dozen atoms in each layer and could not be measured.
You can run the whole investigation yourself. Sign in, start a new Crystal Lab project, open the chat, and type these prompts in order. Each experiment returns a chart of the temperature profile in the chat.
Salt
- Run one experiment — “Load sodium chloride into the lab as a 2x2x8 supercell. Then hold the bottom of the slab at 500 K and the top at 100 K and measure how heat conducts through it.”
- Ask about the result — “Why is the conductivity below the handbook value?”
- Vary the length — “Now run the same slab experiment at 4, 8, 12 and 16 cells, 60 ps each, and extrapolate the conductivity to the bulk value.”
Silicon
- Run one experiment — “Load silicon into the lab as a 2x2x8 supercell. Then hold the bottom of the slab at 600 K and the top at 100 K and show me how heat conducts through it.”
- Ask about the result — “Why does the temperature drop so sharply at the edges of the two thermostatted bands, and why is the conductivity so far below bulk silicon?”
- Vary the length — “Now run the same slab experiment at 4, 8, 12 and 16 cells, 60 ps each, and extrapolate the conductivity to the bulk value.”
The first experiment takes about ten minutes, and the series of four lengths takes one to two hours. The lab keeps the two thermostats set after each run, so you can press Play and watch the experiment, or change the bath temperatures and run it again.
Temperature Jumps at the Bands
The temperature profile is nearly a straight line across the middle of the slab, as Fourier's law predicts. It bows slightly, because the conductivity falls as the temperature rises, so the interior near the hot band needs a steeper gradient to carry the same heat. In the longest salt slab, the bow is about 20 to 30 K at the middle, about as large as the scatter of the layer temperatures. At the two edges where the thermostatted bands meet the rest of the crystal, the profile jumps. In the first salt run, the interior accounts for about 181 K of the 400 K difference between the baths, and the two jumps and the uneven bands account for the rest. In the two runs on the 4.2 nm silicon slab, the interior accounts for only about 40 to 55 K of 500 K.
Each jump comes from a thermal contact resistance. The heat a thermostat supplies or removes must cross the inner edge of its band, where the band meets the rest of the crystal, and heat crosses that edge only with a temperature difference across it, as it does at the boundary between two different materials. In trial runs, the jumps stayed about the same when the thermostat was replaced by a different kind or coupled more or less strongly to its atoms, so they do not come from the details of the thermostat. They come from phonons that travel from one band toward the other without scattering. Such a phonon carries the temperature of the band it left, so near each edge the interior holds a mix of phonons from both bands, and its temperature lies between those of the two bands, away from that of the band next to it. The more phonons cross without scattering, the larger the jumps, which is why they are so large in silicon. The fit leaves the jumps out, so the measured gradient and the conductivity computed from it describe the interior of the slab.
From a Sample to a Material
The kinetic theory of phonons gives the conductivity as κ = C v ℓ/3, where C is the heat capacity per unit volume, v is the speed of the phonons, and ℓ is their mean free path. In a bulk crystal, ℓ is set by collisions between phonons and with defects. In a slab, a phonon also scatters when it reaches the hot or the cold band, so the distance it travels between collisions is limited by the slab length L. The two kinds of scattering add their rates (Matthiessen's rule), so the reciprocal of the mean free path is the bulk value plus a term proportional to 1/L. Because κ is proportional to ℓ, the measured conductivity follows the same form:
1/κ = 1/κ∞ + b/L,
where κ∞ is the conductivity of the bulk material and b is a constant. Plotted against 1/L, the reciprocal of the measured conductivity is a straight line, and its intercept at 1/L = 0, which corresponds to an infinitely long sample, is the reciprocal of the bulk conductivity. This extrapolation was introduced by Patrick Schelling, Simon Phillpot, and Pawel Keblinski in 2002. The straight line holds when the slab is at least comparable in length to the mean free paths of the phonons that carry most of the heat. In a much shorter slab, most phonons cross from one band to the other without scattering, and the points fall off the line. Because those mean free paths span a wide range, Daniel Sellan and coworkers showed in 2010 that the line can bend for samples shorter than the longest of them, and the extrapolation can then fall below the bulk value.
In the third turn of the salt example, the experiment is repeated on four slabs, 4, 8, 12, and 16 unit cells long, for 60 picoseconds each, and the line is fitted. The measured conductivity rises with length:
| Length (nm) | Ions | Gradient (K/nm) | κ (W/(m·K)) |
|---|---|---|---|
| 1.97 | 128 | 153 ± 10 | 1.15 |
| 4.22 | 256 | 76 ± 4 | 2.12 |
| 6.48 | 384 | 58 ± 2 | 2.69 |
| 8.73 | 512 | 46 ± 2 | 3.55 |
All four points lie within about 5 percent of one line, and its intercept gives a bulk conductivity of 7.7 W/(m·K), with a range of 6.9 to 8.7. The handbook value at room temperature is 6.5 W/(m·K). The 4.2 nm slab measured 2.29 W/(m·K) in the first run, which lasted 30 picoseconds, and 2.12 in this one, which lasted 60. The two independent runs of the same slab agree within 8 percent. On a chart of κ against length, the fitted line appears as a curve that rises toward the bulk value.
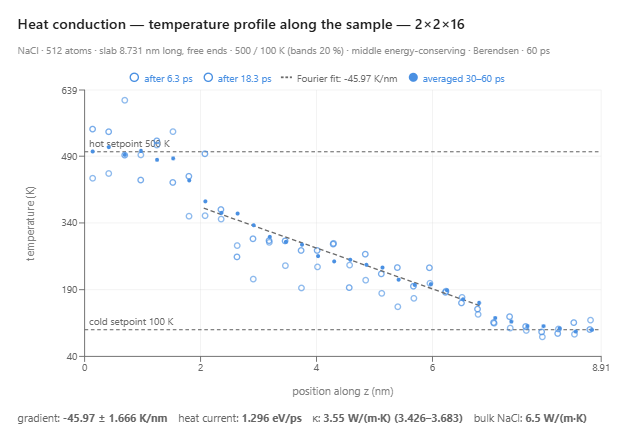
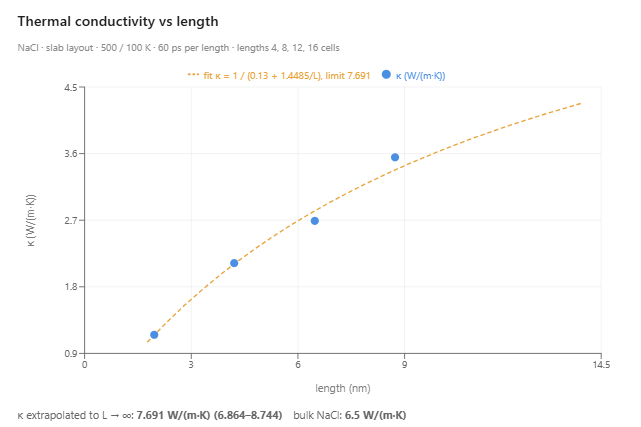
The extrapolated value is about 20 percent above the handbook value, and temperature can account for the difference. Taking the longest slab as representative, the fitted line across its interior runs from about 370 K near the hot band to about 160 K near the cold band. The conductivity of an insulating crystal is roughly inversely proportional to the absolute temperature, and for such a crystal a measurement across the interior gives the conductivity at the logarithmic mean of the two end temperatures, about 250 K here, below room temperature. That raises the conductivity by about 20 percent over its value at 300 K. Corrected to 300 K, the extrapolation gives about 6.4 W/(m·K), with a range of 5.8 to 7.3. The shorter slabs have smaller interior drops and sit at somewhat different mean temperatures, so the correction is approximate. Any remaining difference can come from the force model. The forces between the ions follow the rigid-ion potential of Fausto Fumi and Mario Tosi, whose repulsive parameters were fitted to the lattice spacing and the compressibility of the alkali halides, and its phonons can differ from those of real salt.
Silicon: A Slab Shorter Than the Phonon Path
The extrapolation reaches a bulk value for salt because the slabs are comparable in length to the phonon mean free path. The kinetic formula with the handbook conductivity, heat capacity, and speed of sound of sodium chloride gives an average mean free path of a few nanometers. Some phonons travel farther than this average, so the salt slabs sit at the short end of what the extrapolation needs, and the agreement with the handbook value suggests that they are long enough. In silicon, the phonons that carry most of the heat travel hundreds of nanometers before they scatter. The second example runs the same experiment on silicon, with the forces given by the potential of Frank Stillinger and Thomas Weber, the baths at 600 K and 100 K, and the same four lengths. Molecular dynamics treats the vibrations of the atoms classically, which is accurate only well above a crystal's Debye temperature. For salt, whose Debye temperature is about 320 K, the approximation is rough at the cold end of the interior, near 160 K, where the classical heat capacity is about 20 percent too high. For silicon at 100 K, far below its Debye temperature of about 645 K, it is poor, which is a further reason the silicon results cannot be compared directly with the handbook value.
| Length (nm) | Atoms | Gradient (K/nm) | κ (W/(m·K)) |
|---|---|---|---|
| 2.0 | 128 | 109 ± 18 | 0.44 |
| 4.2 | 256 | 22 ± 5 | 6.4 |
| 6.4 | 384 | 13 ± 2 | 11.7 |
| 8.6 | 512 | 8 ± 1 | 21.9 |
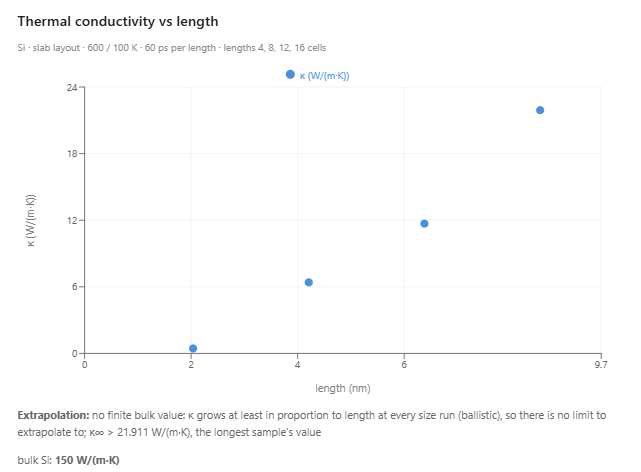
The conductivity of silicon more than triples while the length doubles from 4.2 to 8.6 nm. Ballistic transport explains a conductivity that grows in proportion to the length: most phonons cross the whole slab without scattering, the slab passes the same heat current whatever its length, and most of the temperature drop occurs at the two jumps. The three longer slabs behave this way: the temperature drop across the interior stays at about 40 to 55 K while the length doubles, so the gradient falls in proportion to 1/L and κ rises in proportion to L. In salt, by contrast, the interior drop grows with the length. Growth faster than the length has no such explanation and lies within the scatter of single runs, described in the next paragraph. In this series, the line of 1/κ against 1/L has a small negative intercept whichever lengths are kept, which is zero within that scatter, and the extrapolation yields no bulk value. The firmest number is that of the longest slab, whose gradient is measured to within 12 percent, but it may also depend on the width of the slab. In a trial series on slabs three cells wide, the 8.6 nm slab measured 15.0 W/(m·K), either a width effect or the same run-to-run scatter. The bulk conductivity of this model of silicon is therefore at least about 15 to 20 W/(m·K) in the widths tried. Reaching the bulk conductivity of silicon by this method requires slabs tens to hundreds of nanometers long, as the study by Sellan and coworkers showed for this same model of silicon. Such slabs hold far more atoms than a simulation in a web browser can follow.
Silicon also shows how much a single run on a few hundred atoms varies. The 4.2 nm slab measured 12.2 W/(m·K) in the first run and 6.4 in the ladder of lengths. Its interior gradient was 15 K/nm in one run and 22 K/nm in the other, with uncertainties of 32 and 23 percent. In salt, where the interior gradient is measured to within 4 to 7 percent, the same comparison agrees within 8 percent. With the first-run value of 12.2 in place of 6.4, the line through the three longest slabs has a positive intercept and gives a bulk value of about 35 W/(m·K), with no upper limit within its error. Whether silicon slabs this short yield a bulk value at all depends on a single run, and a second series of lengths would settle it.
Why Use AI to Assist Scientific Simulations?
Each measurement in this article requires two thermostats set on two bands of atoms, a run long enough to reach a steady state, a temperature profile averaged over time, a straight-line fit that leaves out the contact layers, and a tally of the energy the baths add and remove. The extrapolation requires the whole experiment at four lengths. The AI agent carries out these steps for the student and reports each number with its uncertainty.
The investigation follows the questions the student asks. A student who wonders why the temperature jumps at the edges of the bands can ask, and the agent explains the contact resistance using the jumps in that student's own chart. A student who asks for a series of lengths gets four new experiments and a chart of the results. The chat log records each question and the run that answered it.
What the Simulations Produced
The simulations were given the forces among the atoms. Everything below came out of them:
- Fourier's law — the temperature falls nearly linearly across the interior of a slab that carries a steady heat current.
- Contact resistance — the temperature jumps where each thermostatted band meets the rest of the crystal.
- A length-dependent conductivity — the measured conductivity of a slab a few nanometers long rises with its length.
- The conductivity of salt — 7.7 W/(m·K) extrapolated from four slabs at an interior temperature near 250 K, or about 6.4 corrected to room temperature, against a handbook value of 6.5.
- Ballistic phonons in silicon — the temperature drop across the interior stays about the same as the slab doubles in length, so the conductivity rises in proportion to the length and has no bulk value within reach.
Conclusion
This article uses heat conduction to illustrate a new way to learn science: students converse with an AI agent that turns a plain-language question into a molecular dynamics experiment and hands back measured data. Fourier's law and the thermal conductivity listed in a handbook become something students measure for themselves, and the comparison of salt and silicon shows them when a measurement on a small sample describes the material. By pairing a physically grounded simulation with an AI that can set it up and run it, AIMS lets students trace the flow of heat to the vibrations of individual atoms and turns their curiosity into a genuine scientific investigation of how heat moves through solids.
← Back to AIMS